Earnings Power Day – Facebook – Apple – Starbucks

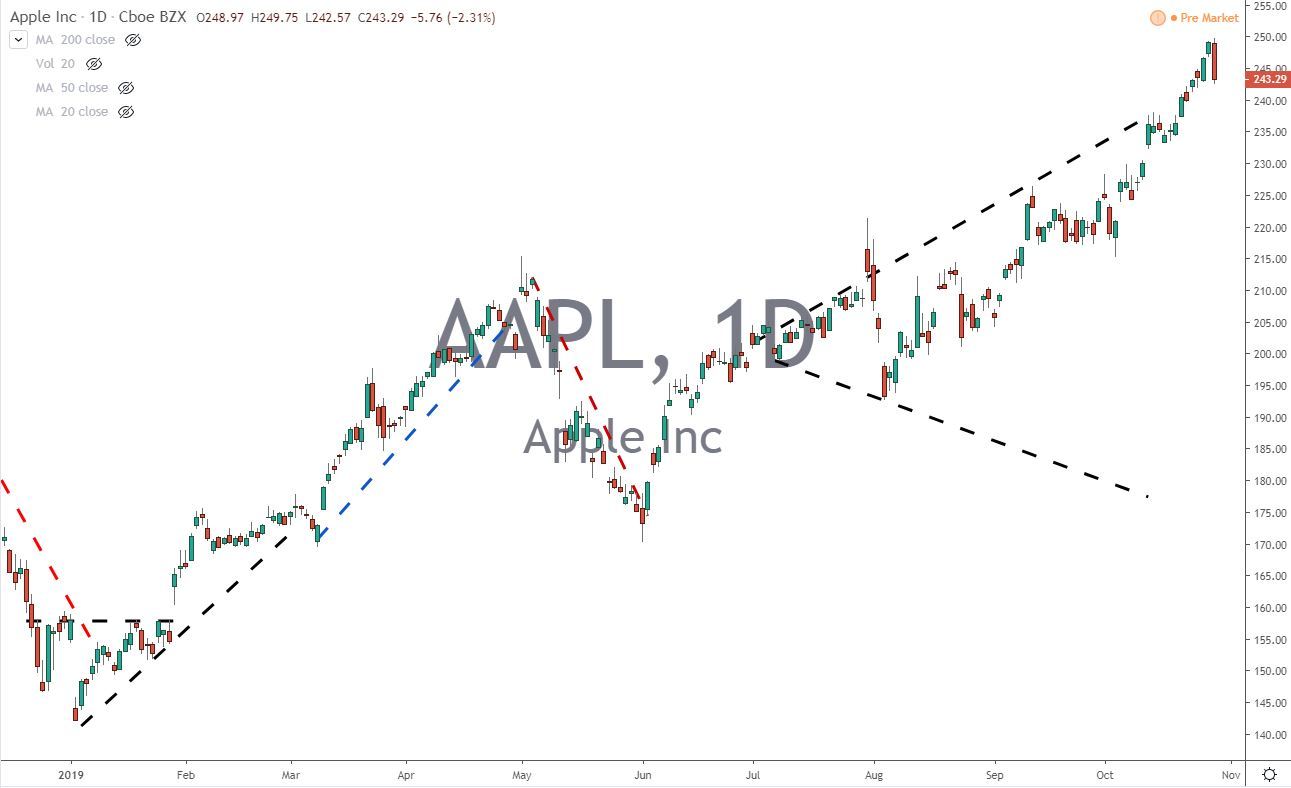
AAPL Apple Inc Stock Chart Before Earnings 10.30.19
Apple Earnings: What to Look For
Apple Inc. (AAPL), whose flagship iPhone product has been the main driver of the company's stock, is scheduled to report results for Q4 of fiscal year 2019 after the close on Oct. 30. Apple is expected to announce flat revenue with earnings slipping 2.7%, according to consensus estimates.
Analysts' tepid forecasts illustrate Apple's challenge of diversifying its sales away from the iPhone, which once generated more than 60% of its sales.
investopedia.com/apple-earnings-10-30-19
Here's What To Expect When Facebook Reports Quarterly Earnings
Facebook (FB) plans to report third-quarter earnings Wednesday at a time when the social networking giant sits squarely in the crosshairs of antitrust regulators. The Facebook earnings report arrives after the market close.
Wall Street expects Facebook to report adjusted earnings of $1.91 per share. That represents a 9% increase from the year-ago quarter […]
investors.com/facebook-earnings-10-30-19
Starbucks earnings preview: A Nitro-powered quarter will drive U.S. same-restaurant sales
Starbucks shares are down nearly 16% for the past three months, but have rallied nearly 30% for 2019.
Starbucks Corp. is scheduled to report fiscal fourth-quarter earnings on Wednesday after the closing bell, and KeyBanc Capital Markets analysts expect the Nitro beverage to power U.S. same-restaurant sales.
marketwatch.com/starbucks-earnings-report-10-30-19
Roku Stock Jumps as Value Increases 4.5X YTD
Throughout the year, Roku (ROKU) stock has climbed consistently. At the beginning of 2019, the stock kicked off at a moderate $32.52.
The company’s stock price crossed $50 in February, $100 in the first week of June, and the $150 threshold at the end of August.
New 7-Step Checklist for High Probability Trades
“The core strategy we teach our students is deceptively simple; Accept risk on great ideas, and let everything else go.”
Most new students have the same question: “What is a great trading idea? How do I position myself to earn consistent money?”
- Great trading ideas are built upon great arguments. A weak argument is; “I see the stop loss, I see my risk.”
- A better argument is; “The stock is strong, I see the profit potential, and I see the stop loss (my risk).”
The first idea simply acknowledges the risk. The second idea develops a reason for accepting the risk. The second idea is the beginning of a strategy.
High probability trades build an argument for accepting risk. In order to build an argument, you need criteria. This criteria, defines your edge.
There are infinite possibilities to identify a trading edge. This checklist is designed to inspire criteria that work for you.
Developing High Probability Trades
A solid trading foundation weighs the delicate balance between risk and opportunity. Smart traders pursue opportunities that match their resources.
Risk is relative to each of us. Opportunity should be relative to risk.
Use these seven criteria as a starting point, and then adapt the concepts to your unique resources and goals.
Criteria #1: Institutional Activity:
An element of risk is liquidity. A smart trader must consider the activity level of each stock. The more shares traded, and available to trade against, the better the chance to buy or sell at a reasonable price. A baseline criteria is an average of 2 million shares traded per day.
Criteria #2: Opportunity:
Each stock has a certain volatility, or average dollar amount from high low each day. Too little, and your profit potential diminishes. Too much, and you will trade scared. A good starting point is a one dollar average true range. (Using a 14 period calculation)
Criteria #3: Price Trends:
An obvious trend to institutional activity, defines a bias. Are buyers or sellers in charge? How do you know? Consider using a 20 period simple moving average to determine your bias.
This foundational bias sets the stage for actively pursuing opportunity. If this bias is not obvious, you have a weak argument.
Criteria #4: Price Change Between Trading Sessions:
This criteria represents the bias from yesterday’s closing price to the current price. If this net change is in sync with the price trend bias, your argument begins to get stronger.
Criteria #5: Today’s Institutional Activity:
This criteria identifies today’s bias. Monitor the last price, relative to today’s open price. When this criteria is in sync with criteria #3 & 4, your argument begins to strengthen.
You can see this criteria in a glance, using candlestick charts. You are looking for a red or green candle to show you today’s bias. This criteria keeps your argument relative to today’s activity.
Criteria #6: Institutional Follow-Through:
Are institutions supporting higher prices and creating new highs, compared to yesterday? And vice versa for a selling opportunity. Using daily charts, identify if your stock is showing a higher low, and a higher high, compared to yesterday’s price action.
Criteria #7: Relative Strength:
Run criteria #3-6 for the $SPX. You are seeking opportunities when your stock, is trading in sync with the general market. When the indices meet your minimum criteria, there is a bias to the mass of stocks. When your stock is in sync with this bias, you have what is known as relative strength.
Recap:
This list is by no means exhaustive nor final. We are providing a framework to develop your own ideas.
The key to high probability trading is structure. To manage risk and pursue opportunity, you need reasons to act. These seven criteria provide a guideline for building an argument.
Pete
