Symantec Stock Prices Implodes More than 12 Percent-CEO Quits

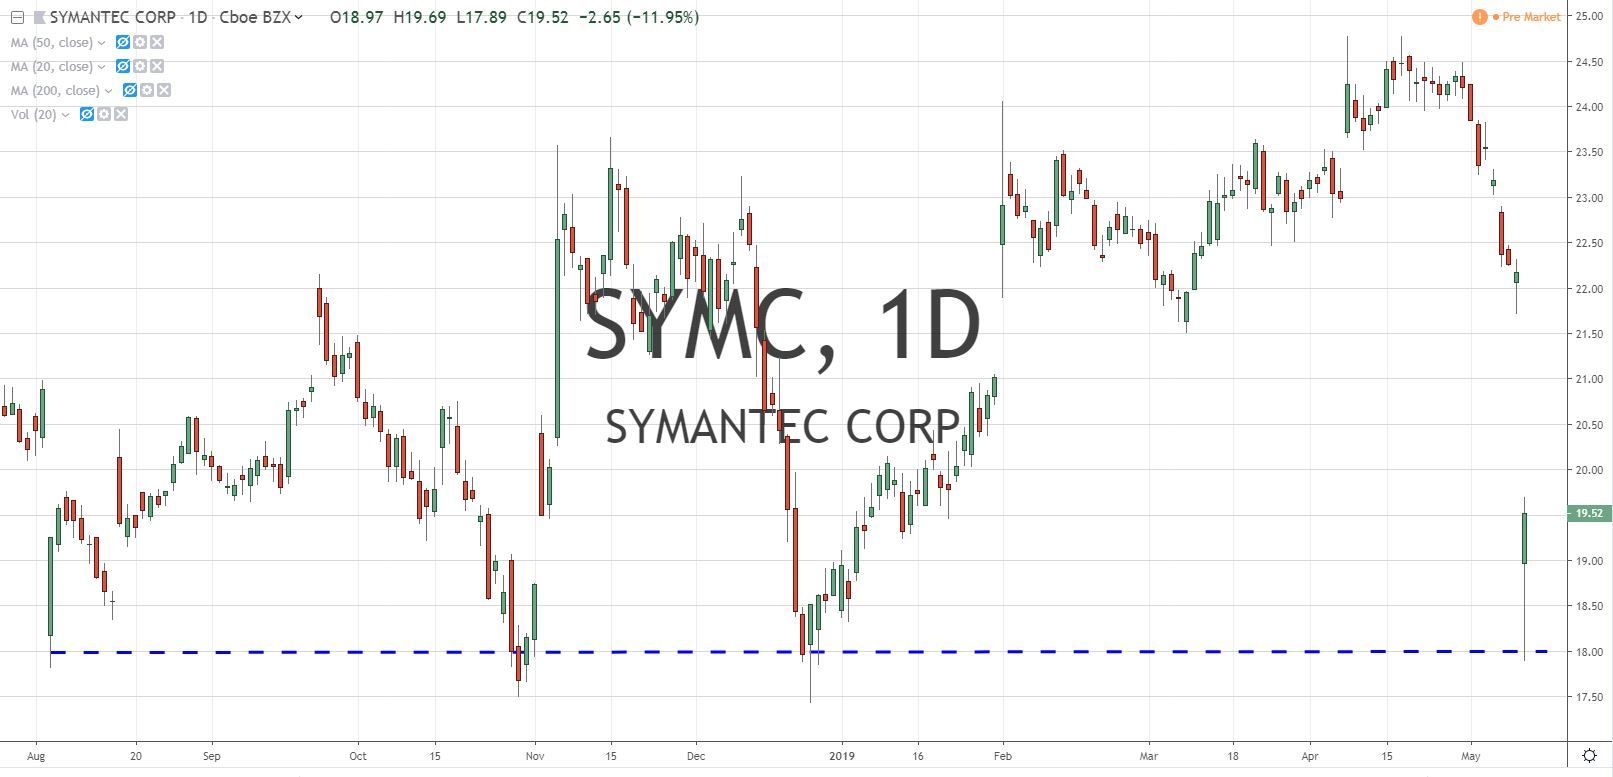
Symantec Stock Chart SYMC 5.13.19
Symantec stock sinks for worst day in a year on poor performance, CEO departure
Symantec Corp. shares dropped Friday for their worst performance in a year as analysts slashed price targets and estimates for the security software company that turned in another poor performance and outlook and shook up its top management ranks.
Symantec SYMC, -12.54% shares dropped more than 13% to $19.18 at least check, having touched an intraday low of $17.89, for their worst day in a year…
marketwatch.com/symantec-stock-sinks-ceo-resigns
Symantec's Stock Looks Like a Value Trap for Now
The security tech firm just reported a major billings decline, issued weak guidance and announced its CEO has resigned. Wall Street has its reasons for giving the company a relatively low valuation.
At first glance, Symantec's multiples look reasonable relative to those of many peers: The company's enterprise value (market cap plus net debt) is equal to about 14 times its expected fiscal 2020 free cash flow (FCF), and less than 12 times its expected fiscal 2021 FCF.
But there are clearly good reasons why Symantec is given such a valuation discount, and with the company having done little as of late to dispel top-line worries, and now in the midst of a CEO search, it wouldn't be surprising to see its estimates taken down further.
realmoney.thestreet.com/investing/symantec-stock
U.S.-China trade setback prolongs the global equities slide
LONDON (Reuters) – Global equities fell on Monday after their worst week of 2019, as hopes of an imminent U.S.-China trade deal were crushed and neither side showed a willingness to budge, raising fears of a fresh round of tit-for-tat tariffs.
The United States and China appeared at a deadlock over trade negotiations on Sunday as Washington demanded promises of concrete changes to Chinese law and Beijing said it would not swallow any “bitter fruit” that harmed its interests.
Trading Lesson
One of the most misunderstood concepts in trading is support and resistance.
Basic technical analysis books, heck even advanced books… teach to look for the high and the low of the candlestick and use that for support and resistance.
It's wrong.
The obvious reason? What if only one hundreds shares traded at that price? But the stock traded 5 million shares that day? You are going to give the utmost significance to a stock price with such little money changing hands? It's actually irresponsible.
So what should you do? What should you look for?
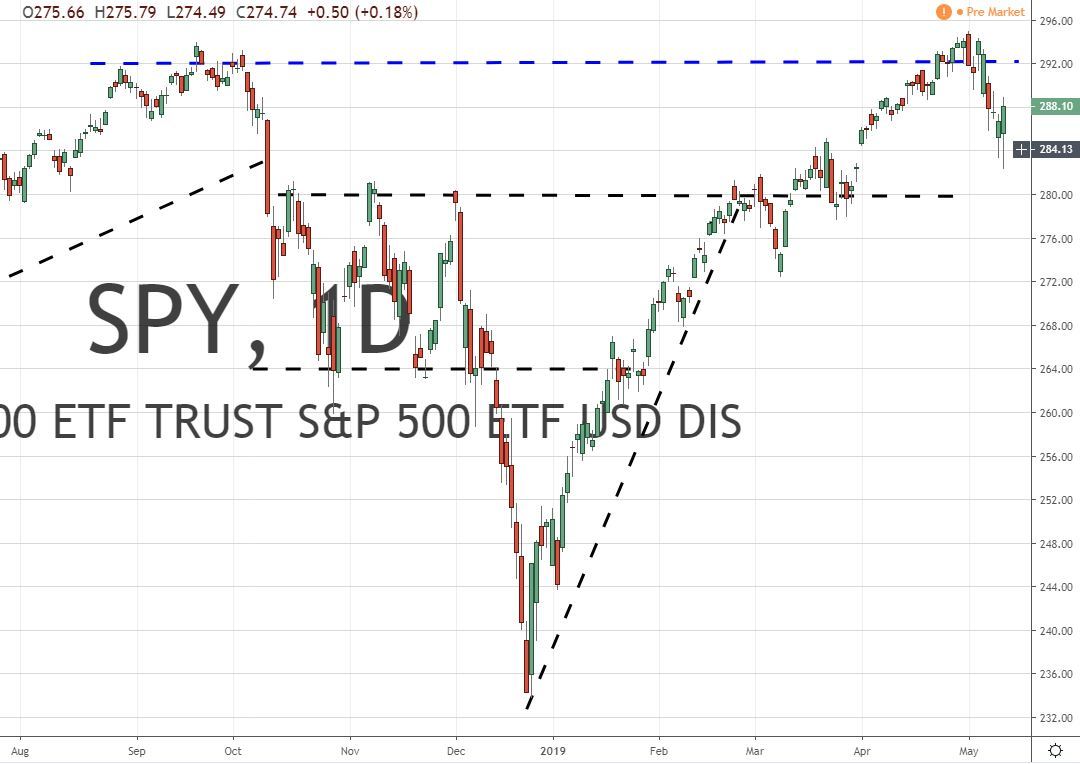
This chart of SYMC gives the answer. You look for the true price buyers or sellers are negotiating. In this case it's $18. NOT the low of $17.50. We see the same scenario in the chart of the SPY ETF below.
Listen to any talking head and they're talking about $294.95. But a closer, more professional look at the chart shows $292 is the true resistance. The true level buyers can't hold.
Why is this lesson important? Stop losses and profit targets. If you set your entries and exits around the wrong true levels, you exit winners too soon and hold lowers too long. You give up money for no reason.
Go back and look at some charts. You'll see them differently. As with order flow, look beyond the basic chart and ask what's going on behind the scenes.
Pete

SPY ETF Chart 292
